Working as a Data Scientist for a widget in e-commerce, one of my responsibilities was 'overseeing A/B testing.'
There were a lot of assumptions about how testing should work:
At the same time, account managers were somewhat afraid of A/B tests:
There must be a better way!
For simplicity's sake, let's just talk about a button we want people to click. We want more of them to click it. At the moment, we'll ignore the 'quality' of the click (if more click but fewer buy, for instance, that could be bad).
The "human" part of alternatives testing should really be limited: picking alternatives. Once a new alternative has been selected — meaning we all agree that if it gets more clicks, we want to use it — it should just enter the mix to crash or burn.
A system that gets this right and removes the earlier obstacles should probably have these features:
We can construct such an online system leveraging Bayesian statistics. Rather than the old model's separation of "data collection" and "certainty analysis" phases, Bayesian methods allow us to do both simultaneously.
Not writing a textbook here, so I'll just put this informally: Bayesian methods focus on conditional probability and giving distributions rather than specific estimates. This is intuitive: the ballpark performance you'd estimate for a button design given no evidence is probably wider than the ballpark you'd give after 5000 people have seen it and some percentage have clicked it.
It turns out there's a nice probability distribution, the Beta distribution, that corresponds to estimating the rate at which some binary thing is True. It (roughly) has two parameters: number of successes and number of failures.
For instance, here's a Beta(10, 990) and a Beta(100, 9900) distribution overlaid:
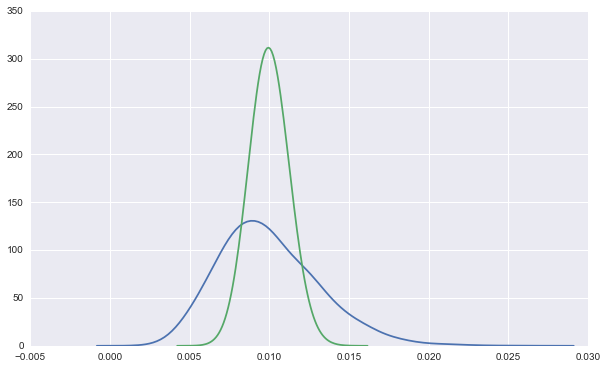
Both lines represent data from a 1% CTR button. The green line is the distribution after 10000 such views, so it is tightening in on the true rate, while the blue is after only 1000, and is much wider.
Importantly, while we can be sure the green line didn't come from a button with a long run CTR of 1.5%, the blue line is still substantially above zero at the 1.5% mark.
With the basics done, here's the pseuocode for my approach:
initialize beta distribution for each alternative
set the parameters of these to reflect 100 impressions with your 'goal' CTR

for each page load:
    draw one value from each beta distribution
    get the index of the largest draw
    show the button corresponding to that index
    update that beta distribution with the outcome of the render
At any time, you can add or remove alternatives. You just need to initialize new entries with parameters that will beat your current winner so that they make it into the mix. Removal is trivial but unnecessary, since losing alternatives will be irrelevant.
