A fun thing about switching between programming & statisticizing is that when you're in one mode you can allow yourself to totally cut corners on the other mode, and promise yourself you'll fix it later.
For instance, if I'm programming, I might bracket a probability problem ("let's just take the average") and then solve it properly later. Coincidentally, this also makes for nice potential interview questions: "an engineer concludes X, how do you explain their error to them?"
Sound fun? Okay, here's one:
An engineer, Phil, is simulating an incoming request volume to test out a real time process. Phil knows there are on average 50 requests a second. Phil has a process that should fire every 6 seconds, and its performance may depend on how many requests have happened since it last ran. He wants to be probabilistic about it to get a better idea of real world performance.
Phil's logic goes like this:
How will Phil's simulation differ from what you would actually expect? How would you have modeled it?
What Phil has modeled is a process that shares only one thing with the real process: the mean.
Phil's model will produce results like these:
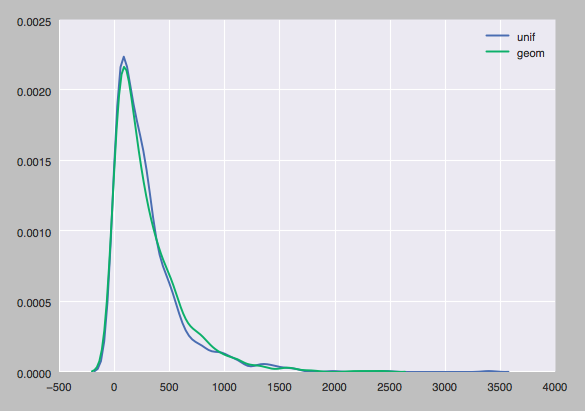
This thing averages to 300, but obviously the odds of being in the 200-300 range are way higher than the 300-400 range, which is probably not accurate as a model of request volume. Batch sizes as calculated from "Phil's model" are overlaid with draws from the geometric distribution, the "real thing" Phil's model reflects.
So what's the problem? Suppose a request arrives in the first microsecond of a second: is it really true that there's a 1/300 chance that no requests arrive during the next 9.9x10^5 microseconds? And that this 1/300 likelihood is also the odds of a request in the last microsecond being the last one that second? Clearly this is wrong.
What Phil missed is that the real phenomenon with that sort of even random draws is the arrival of a request in each microsecond, not likelihood of a request being the last member of a batch. It's more like (and even this is not quite right since there can be simultaneous arrivals) each microsecond has a 50/10^6 chance of containing a request (req/sec divided by microseconds/seq).
If each microsecond gets this independent shot at a uniform distribution, the arrival times take the shape that we saw above. That is, the probability of a a request arriving in the current microsecond is p, or in general, is (1 - p)^k * p, where k is the number of seconds. This arrival times model fixes our issues with the first/last microsecond thought experiment above. The odds of a first-microsecond request being the last in a batch are the same as the odds of the next arrival time being a full batch-duration away: you look way out down the right tail where the probability is very low. The odds of a last-microsecond request being the final request that batch, however, comes from the fat far left end of the distribution, as it's just the odds of not seeing another request that microsecond.
With such a large number of random draws in each batch, the number of successes is going to be much more strongly "about the mean" than the what you would see if you drew once per success. Indeed, you can simulate a bunch of batches according to this 'random draw each microsecond' logic:
mu_unif_draws = []
mu_p = 50. / 10**6

for i in range(1000):
    ct = 0
    for s in range(6):
        draws = UNIFORM.rvs(10**6)
        ct += np.sum(draws < mu_p)
    mu_unif_draws.append(ct)
For comparison, we can also draw from the Poisson distribution, which maybe you've heard of as a model of 'expected arrivals within a time period':
p = poisson(50)
poisson_draws = np.sum(p.rvs(6000).reshape(1000, 6), axis=1)
Here are those two sets of batch size draws:
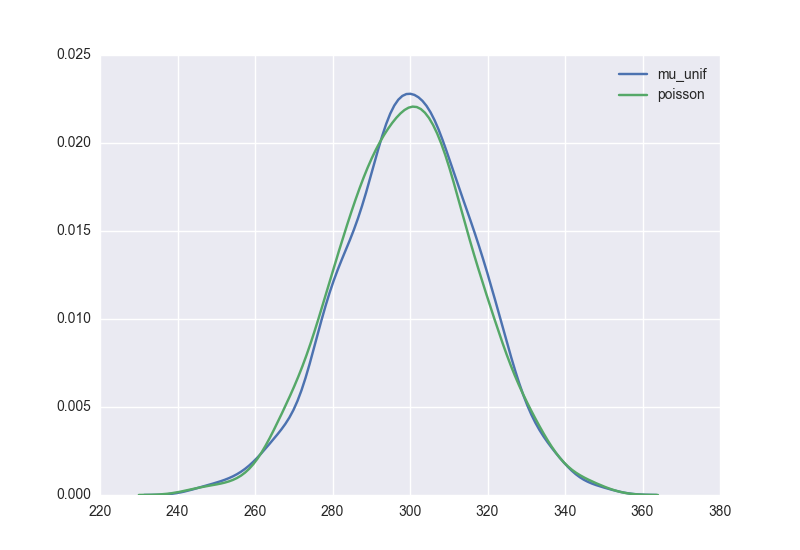
Right on! And pretty symmetric about the mean!
So now Phil knows about the Poisson distribution and its relation to arrival times. And hopefully Phil knows a little better about when you can't just use the average and move along.
